使用过 LaTeX beamer 的用户对其自动创建导航栏的功能一定不会陌生。使用导航栏可以很好地梳理展示的逻辑,并且时刻提醒听众当前所处的上下文位置。而在 PowerPoint 中,没有自动创建类似导航栏的功能。因此,我们现在使用 Office 开放的 Javascript API 来编写一个 PowerPoint 中可以使用的,功能与 LaTeX beamer 类似的导航栏加载项:Navbar。
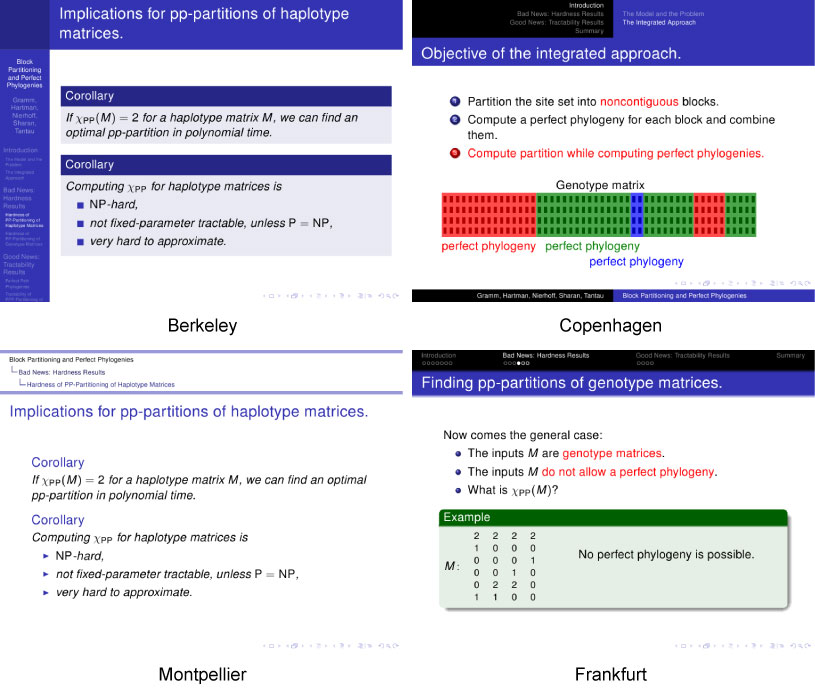
没有使用过 LaTeX beamer 的用户可以参考下图。 LaTeX 是一个排版引擎,可以将标记语言编写的文本文档编译成排版后的 pdf 文档。下图给出了一些 LaTeX beamer 自动生成导航栏的示例。每个图片下面对应了一个城市名,是 LaTeX beamer 内置的主题。
我们先从创建最简单的导航栏入手,再一步步地丰富加载项的功能。读者跟随我的思路,也可以从零开始学习使用 Office 的 Javascript API。
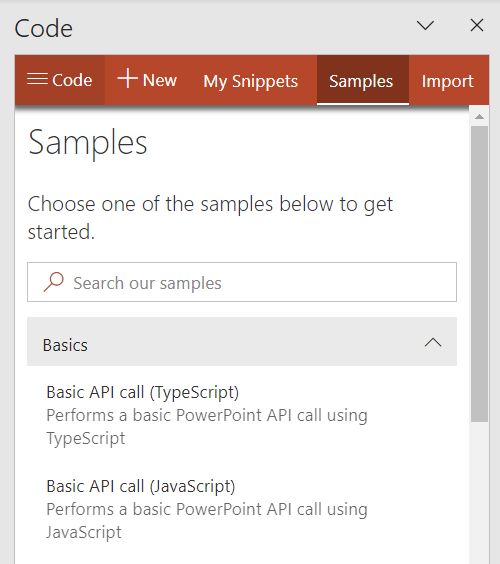
搭建脚手架 Office 加载项最快上手的方式是使用 Script Lab 加载项。在 Ribbon 的“插入”菜单中选项“加载项”(即 Add-in),里面有一个 Office 的加载项商店。在商店中列举了一些常用的加载项,在里面可以找到 Script Lab 并安装。安装完成后打开,就可以看到下图所示的侧边栏。
如果加载项商店打不开,可以尝试登陆网页版的 PowerPoint 。在浏览器中键入 office.com 即可。
在加载项的顶部,有一排按钮。其中一个按钮为 Samples ,给出了一些简单的示例项目。这里我们打开一个 “Basic API call” 的示例来看一下里面的内容(选择 JavaScript 版本)。打开之后的侧边栏如下图所示。
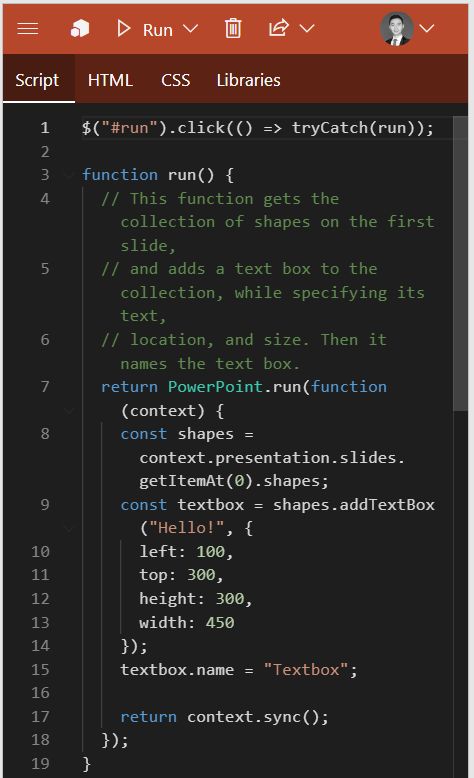
可以看出,一个加载项本质上就是一个网页,由 Script HTML CSS Libraries 四个部分组成。本教程假设读者对编写网页基本熟悉,不作过多的解释。我们来看 Script 的内容:
1 2 3 4 5 6 7 8 9 10 11 12 13 14 15 16 17 18 19 20 21 22 23 24 25 26 27 28 29 30 $("#run" ).click(() => tryCatch(run)); function run ( return PowerPoint.run(function (context ) const shapes = context.presentation.slides.getItemAt(0 ).shapes; const textbox = shapes.addTextBox("Hello!" , { left : 100 , top : 300 , height : 300 , width : 450 }); textbox.name = "Textbox" ; return context.sync(); }); } async function tryCatch (callback ) try { await callback(); } catch (error) { console .error(error); } }
简单地解释这段代码。首先,通过 jQuery 的语法,定义了 id 为 run 的 Html 元素的 click 事件要执行的函数 tryCatch(run) 。能使用 jQuery 是因为在 Libraries 选项卡中引入了 jQuery 。当然,也要引入 Office 提供的 API 库 office.js 。在 Html 窗体中已经定义了一个简单的界面,其中有一个写有 “Add text box” 的按钮,这个按钮的 id 便是 run 。因此,点击这个按钮,就会执行 tryCatch(run) 函数。
再看 tryCatch() 函数做的事情,其实比较简单,就是把要执行的函数用 try 和 catch 包裹起来。这里就是提醒作者要进行异常处理。那么后面要编写的函数都应该用 tryCatch() 这个 Defalut helper 包裹起来使用。
再来看主要的 run() 函数实现的功能。它实际上返回了一个 Promise ,这个 Promise 是 PowerPoint 库中默认提供的 run 函数返回的。具体的逻辑我们不需要了解,只需要看它传入的函数即可。
传入的匿名函数有一个参数 context 。这个参数即为 PowerPoint 软件与加载项通信所使用的上下文对象。再来看这个函数实现了什么。首先,定义了一个常量 shapes ,并传入了第一张幻灯片的所有 shapes 。然后又定义了一个常量 textbox ,并在初始化时创建了一个文本框,并给定了它的文字、大小、位置。之后对这个 textbox 赋予了一个用于脚本识别的 name 属性,名为 Textbox 。最后,返回了一个 context.sync() 的 Promise ,使得 context 的更新得以执行。
上面解释了这段代码的意义和功能。我们来尝试运行一下。点击 Run 按钮,选择 “Run in this pane”。插件就可以运行了。在界面中可以看到 html 定义的文字和按钮,点击按钮,可以发现在第一页幻灯片中出现了相应文本框。
有了 Script Lab ,即使电脑上没有安装 Node.js ,也没有 Visual studio ,还是能够快速地开发 Office 加载项。这就给我们提供了很大的方便。不需要掌握非常复杂的 Node 操作以及前端打包技术,也可以快速地开始一个加载项的原型编写。在本文中我们就使用 Script Lab 来创建 Navbar 加载项,以实现在 PowerPoint 中添加导航栏。
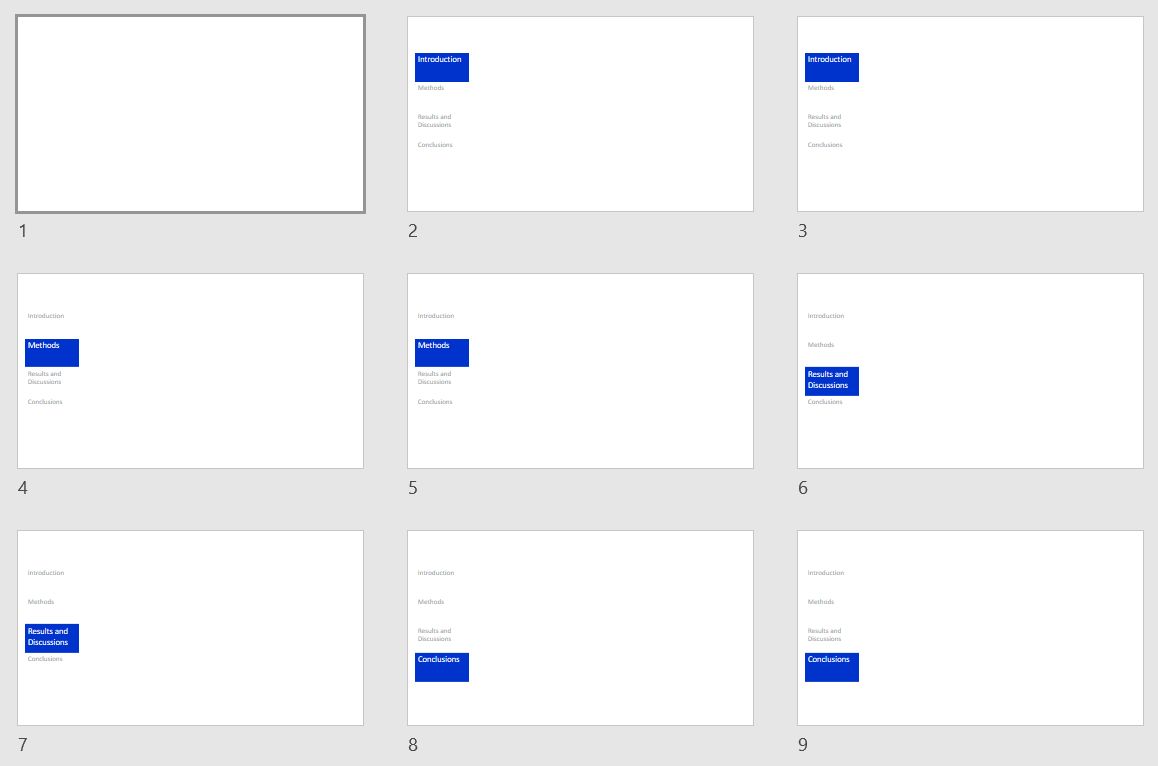
根据分节创建文字 现在我们来实现 Navbar 插件最基础的功能。在幻灯片全部做好后,它可以为每一页幻灯片创建一个导航栏,这个导航栏可以显示当前幻灯片所处的章节,类似于 LaTeX beamer 中的 Berkeley 主题,如下图所示:
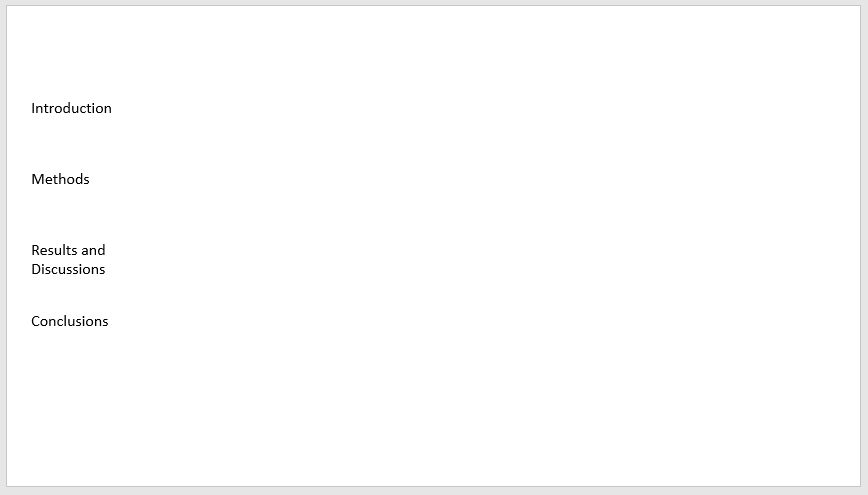
给第一页创建文字 我们现假设这套 ppt 有四个章节,用一个变量 sectionTitles 来保存章节标题。然后对每一个章节标题创建一个文本框,用坐标和大小来定义它的出现位置。
1
2
3
4
5
6
7
8
9
10
11
12
13
14
15
16
17
18
19
20
const sectionTitles = ["Introduction" , "Methods" , "Results and Discussions" , "Conclusions" ];const leftOffset = 20 ;const topOffset = 100 ;const textBoxHeight = 80 ;const textBoxWidth = 150 ;const sectionCount = sectionTitles.length;const lefts = sectionTitles.map(() => leftOffset);const tops = sectionTitles.map((_, i ) => topOffset + textBoxHeight * i);const shapes = context.presentation.slides.getItemAt(0 ).shapes;sectionTitles.map((title, i ) => { const textBox = shapes.addTextBox(title, { left : lefts[i], top : tops[i], width : textBoxWidth, height : textBoxHeight, }); textBox.name = `NavbarSectionTextbox${i} ` ; }); return context.sync();
用以上代码替换原来的插入文本框部分,可以看到,四个文本框都插入进 PowerPoint 中了,如图所示。
以上代码中,首先定义了一些常量,是用于测试的数据。后期这些常量要封装到函数中,由用户传入。lefts 和 tops 是文本框的坐标,提前计算是为了以后加入更加复杂的坐标计算逻辑。
为了获得一个页面,可以使用 presentation 中提供的 getItemAt() 方法。这个方法传入一个从零开始的幻灯片的序号。通过 slide.shapes 属性可以得到一个 ShapeCollection 对象,表示一页幻灯片里的所有形状。它提供一个 addTextBox() 方法用于添加文本框,反回一个 Shape 对象。为了程序调用方便,该对象提供了 name 和 tags 两个属性。 name 是一个字符串, tags 是一组键值对。这里面我们的程序逻辑比较简单,就不添加很多 tags 了,而是将这个加载项创建的所有 shape 用一个以 Navbar 开头的 name 来作为命名空间,以区分于用户自己创建的 shape 。
给所有页都创建文字 下面我们建立 10 页幻灯片,并通过循环,给每一个幻灯片都添加这些文本框。它的实现方式很简单,只需要在刚才的代码外部加一个循环体即可。
1
2
3
4
5
6
7
8
const slideCounter = context.presentation.slides.getCount();context.sync().then(() => { for (let n = 0 ; n < slideCounter.value; n++) { const shapes = context.presentation.slides.getItemAt(n).shapes; }; return context.sync(); })
这里要注意的是,通过 slides 的 getCount() 方法,可以获取页面的总数。但是这个操作是异步的,返回的是一个代理对象。执行这个语句当时是无法获得 slideCounter 的值的。只有在等待 context.sync() 完成之后, slideCounter 的属性 value 才能获取到。因此需要使用这个 slideCounter 的函数要在 sync() 这个异步方法的回调函数中书写。
上面除最后的返回之外,只调用了一次 context.sync() 异步函数,这样书写还是可以接受的。但是如果函数体中需要多次调用这个函数与 PowerPoint 进行交互,那回调函数就会层层嵌套,形成回调陷阱。这里我们使用 async/await 来改写,最后的代码如下:
1
2
3
4
5
6
7
8
9
10
11
12
13
14
15
16
17
18
19
20
21
22
23
24
25
26
27
28
async function run ( await PowerPoint.run(async context=> { const sectionTitles = ["Introduction" , "Methods" , "Results and Discussions" , "Conclusions" ]; const leftOffset = 20 ; const topOffset = 100 ; const textBoxHeight = 80 ; const textBoxWidth = 150 ; const sectionCount = sectionTitles.length; const lefts = sectionTitles.map(() => leftOffset); const tops = sectionTitles.map((_, i ) => topOffset + textBoxHeight * i); const slideCounter = context.presentation.slides.getCount(); await context.sync(); for (let n = 0 ; n < slideCounter.value; n++) { const shapes = context.presentation.slides.getItemAt(n).shapes; sectionTitles.map((title, i ) => { const textBox = shapes.addTextBox(title, { left : lefts[i], top : tops[i], width : textBoxWidth, height : textBoxHeight, }); textBox.name = `NavbarSectionTextbox${i} ` ; }); } await context.sync(); }); }
文字样式与章节对应 现在我们需要知道每一页幻灯片是属于哪个节的。这里我们创建一个变量 slideSectionId ,它保存一个与幻灯片数量相同的 array ,其中每一个元素是对应页幻灯片的节编号。另外加一个小的 trick ,就是如果这一页幻灯片不需要加导航栏(比如首末页,或是每一节的起始页,有时候不需要),就使用 -1 来表示。代码如下:
1 const slideSectionId = [-1 , 0 , 0 , 1 , 1 , 2 , 2 , 3 , 3 , -1 ];
然后我们对活动节的标题和非活动节的标题赋予不同的文字样式,代码如下:
1
2
3
4
5
6
7
8
if (i == slideSectionId[n]) { textBox.textFrame.textRange.font.size = 24 textBox.textFrame.textRange.font.color = 'white' ; textBox.fill.setSolidColor("#0033CC" ); } else { textBox.textFrame.textRange.font.size = 20 textBox.textFrame.textRange.font.color = '#999ea2' ; }
在对 n 循环体的内部第一行加上跳过一页的判断:
1 if (slideSectionId[n] == -1 ) continue ;
运行,可以看到如图所示的导航了。这样就基本完成了对 LaTeX beamer Berkeley 主题中导航栏的模拟,如下图所示。这里只建立了文字部分,加入蓝色是为了更明显。如果需要底色,更好的方法是自行在母版中创建底色。
值得注意的是,超链接功能目前在 PowerPoint 的 javascript API 中还没有置入,所以暂时不支持添加。待以后该功能开放后再来添加。
删除所创建的文字 在调试时,每次创建的文字会叠加起来,而创建了很多文字也不容易删除。所以我们在这里添加一个按钮,用来把我们创建的所有文字都删除掉。
首先在 HTML 窗格中,创建一个删除按钮,顺便将前面的按钮文字修改一下。最后的代码如下:
1 2 3 4 5 6 <button id ="create" class ="ms-Button" > <span class ="ms-Button-label" > Create</span > </button > <button id ="delete" class ="ms-Button" > <span class ="ms-Button-label" > Delete</span > </button >
在 Script 窗格中,把对应的点击事件也进行修改,代码如下:
1 2 $("#create" ).click(() => tryCatch(create)); $("#delete" ).click(() => tryCatch(deleteAllNavbarShapes));
注意这里为了语义化命名,把原来的函数 run() 重命名为 create() 。
然后实现删除的函数 deleteAllNavbarShapes() ,代码如下:
1
2
3
4
5
6
7
8
9
10
11
12
13
14
15
async function deleteAllNavbarShapes ( await PowerPoint.run(async context => { const slideCounter = context.presentation.slides.getCount(); await context.sync(); for (let n = slideCounter.value - 1 ; n >= 0 ; n--) { const shapes = context.presentation.slides.getItemAt(n).shapes.load("items/name" ); await context.sync(); shapes.items.map((shape ) => { if (shape.name.startsWith("Navbar" )) { shape.delete(); } }); } }); }
这段在每个页面中获取所有 shape 的 name 属性。然后对 name 属性的值进行分析。如果 name 是以 “Navbar” 开头的,即我们所使用的命名空间,则对这个 shape 进行删除。从后向前删除避免了在删除过程中 index 变化的处理。
这里值得注意的是,使用了 shapes.load() 方法。事实上,通过 Slide.shapes 等方式得到的 PowerPoint 中的元素对象是一个代理对象,并不自动加载对象的属性。程序需要使用哪些属性就需要通过 load() 方法来加载。并且可以通过字符串中加入 / 的方式来加载更深层的属性。然后这些属性在调用了 context.sync() 之后才会获取到。这种设计减少了与 PowerPoint 建立连接的次数和交互的数据量,使同步效率大大提高。
现在导航栏就已经具备雏形了。打开之后有两个按钮,点击 Create 就可以建立起导航栏,点击 Delete 就可以删掉。对于有 JavaScript 编程能力的用户可以直接使用了,一些需要设置的参数可以直接通过修改代码重新运行来完成。但是作为一个加载项,需要所有用户都可以一目了然地了解它的功能以及操作,所以就需要更细致的处理。
布置方式调整 刚才的实现中,我们定义了一个文本框的宽度和高度,然后把文本框逐一排布。这是最简单的计算方法,还有很多细节没有考虑。本节就使用不同的计算规则来调整导航栏每一个章节标题的布置方式。
竖向等间距分布 前面章节标题是按坐标均匀分布的。它最大的问题就是每个文本框的大小都一样,但是节标题文字的长度是不同的,有时会出现换行。如果某些标题有很多行,而某些标题只有一行,那么视觉上不一定美观。在 LaTeX beamer 中,如果导航栏某一个标题出现了换行,会发现它的文本框高度要高出来一些。下面我们就使用 PowerPoint 的 Shape 提供的自动形状适配文字功能 AutoSizeShapeToFitText ,获取每一个文本框的实际高度,然后通过计算,使各文本框的高度更加合理。目前这个功能还不太完善,只有在文字变化之后才会触发调整。因此实现的思路是,先把文本框都放在初始位置,然后设置为自动适配,再次输入文字,即可获取文字的实际高度,之后再通过计算将文本框移动到合适的位置去。先来看代码:
1
2
3
4
5
6
7
8
9
10
11
12
13
14
15
16
17
18
19
20
21
22
23
24
25
26
27
28
29
30
31
32
33
34
35
36
37
38
39
40
41
42
43
44
45
46
47
const SLIDEWIDTH = 960 ;const SLIDEHEIGHT = 540 ;const sampleVerShapeArgs = { sectionTitles : [ "Introduction" , "This is a very very long section named Methods" , "Results and Discussions" , "Conclusions" ], slideSectionIds : [0 , 1 , 2 , 3 ], edgeOffset : 0 , topOffset : 100 , btmOffset : 20 , width : 150 , dockRight : false }; async function computePropVertEqualSpacing (args ) const { sectionTitles, slideSectionIds, edgeOffset, topOffset, btmOffset, width, dockRight } = args; const length = SLIDEHEIGHT - topOffset - btmOffset; const left = dockRight ? SLIDEWIDTH - edgeOffset - width : edgeOffset; const sectionCount = sectionTitles.length; return await PowerPoint.run(async context => { const allShapes = context.presentation.slides.getItemAt(0 ).shapes; const shapes = sectionTitles.map(name => const shape = allShapes.addTextBox(name); shape.width = width; shape.textFrame.autoSizeSetting = PowerPoint.ShapeAutoSize.autoSizeShapeToFitText; shape.textFrame.textRange.text = name; shape.load("height" ); return shape; }); await context.sync(); const textHeights = shapes.map(shape => shapes.map(shape => const totalHeight = textHeights.reduce((sum, item ) => sum + item); const spacing = (length - totalHeight) / sectionTitles.length; const heights = textHeights.map((h ) => h + spacing); let cum = 0 ; const tops = heights.map((_, i ) => { return (cum += i == 0 ? topOffset : heights[i - 1 ]); }); return Array (sectionCount).fill(0 ).map((_, i ) => { return { height : heights[i], width : width, left : left, top : tops[i] }; }); }); }
在数据模型 sampleVerShapeArgs 中给了一些定位选项。首先是有一个 dockRight ,如果是 true ,则文本框基于右侧定位,否则默认基于左侧。然后设了一个 edgeOffset 定义与边缘的距离,再然后是 width 定义导航栏的宽度。上下分别用 topOffset 和 btmOffset 来定义导航栏的起始和终止位置。
这个函数读取 args 后生成一个 ShapeAddOptions 组成的数组,表示每一个文本框的基本定位信息。 ShapeAddOptions 的接口在 PowerPoint 库中有定义,分别指定了形状的坐标和高宽。得到这一系列参数后,添加图形的时候可以直接使用这些定义了。由于 ShapeAddOptions 太长,我在编程时使用 Prop 这个词带代指。
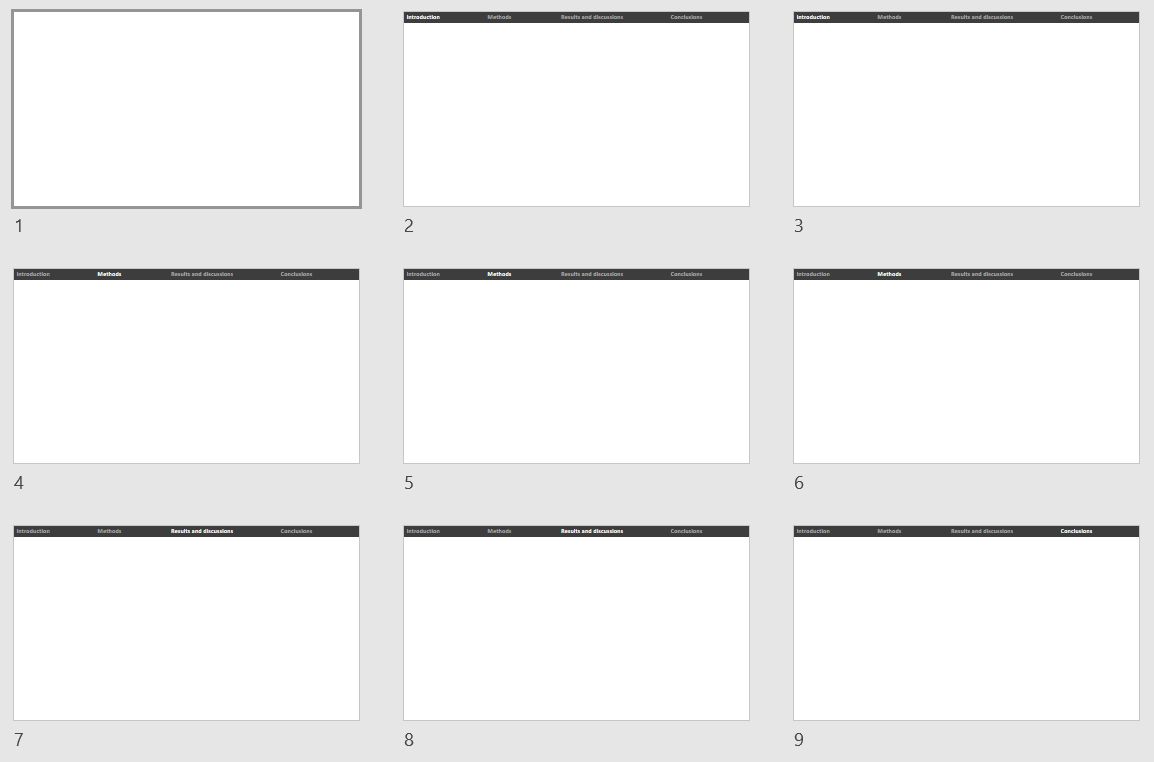
水平等间距分布 如果说等间距分布对于竖向导航栏的作用不是特别明显,那么可以说对于水平导航栏是非常有必要的。因为每个节标题的水平长度势必长短不一,等间距布置会比均匀分布的显示效果好很多。 LaTeX beamer 的 Frankfurt 等主题就是用了这种等间距分布的方式。
由于 PowerPoint 的自动调整机制只调整文本框的高度,而不调整宽度,因此获取每一个章节标题的宽度是一个比较困难的事。这里我们的思路是,先确定单行文本框的高度,然后创建一个测试用的文本框,先给一个比较大的宽度值,如半个 slide 的宽度,然后以 10 为模数逐渐递减,每递减一次获取一下文本框的高度,直到文本框的高度变化,即发生了换行。这时变化之前的文本框宽度值就是紧凑文本框的宽度值。代码如下:
1
2
3
4
5
6
7
8
9
10
11
12
13
14
15
16
17
18
19
20
21
22
23
24
25
26
27
28
29
30
31
32
33
34
35
36
37
38
39
40
41
42
43
44
45
46
47
48
49
50
51
52
53
54
55
56
57
58
59
60
61
62
63
64
65
66
67
68
69
70
71
72
73
74
75
76
77
78
79
80
81
const sampleHorShapeArgs = { sectionTitles : [ "Introduction" , "This is a very very long section named Methods" , "Results and Discussions" , "Conclusions" ], slideSectionIds : [0 , 1 , 2 , 3 ], edgeOffset : 0 , leftOffset : 10 , rightOffset : 20 , height : 30 , dockBottom : true }; async function computePropHorEqualSpacing (args ) const { sectionTitles, slideSectionIds, edgeOffset, leftOffset, rightOffset, height, dockBottom } = args; const initialWidth = SLIDEWIDTH / 2 ; const trialStep = 10 ; const topOffset = dockBottom ? SLIDEHEIGHT - edgeOffset - height : edgeOffset; const length = SLIDEWIDTH - leftOffset - rightOffset; return await PowerPoint.run(async context => { const shapesAll = context.presentation.slides.getItemAt(0 ).shapes; const benchmark = shapesAll.addTextBox("Benchmark" ); benchmark.width = 200 ; benchmark.textFrame.autoSizeSetting = PowerPoint.ShapeAutoSize.autoSizeShapeToFitText; benchmark.textFrame.textRange.text = "Benchmark" ; benchmark.load("height" ); await context.sync(); const benchmarkHeight = benchmark.height; benchmark.delete(); await context.sync(); const shapes = sectionTitles.map((name, i ) => { const shape = shapesAll.addTextBox(name); shape.width = initialWidth; shape.textFrame.autoSizeSetting = PowerPoint.ShapeAutoSize.autoSizeShapeToFitText; shape.textFrame.textRange.text = name; shape.load("height, width" ); return shape; }); await context.sync(); let textWidths = Array (sectionTitles.length).fill(0 ); for (let i = 0 ; i < sectionTitles.length; i++) { let shapeWidth = initialWidth; let shapeHeight = benchmarkHeight; let shape = shapes[i]; while (shapeHeight === benchmarkHeight) { shapeWidth -= trialStep; shape.width = shapeWidth; shape.textFrame.autoSizeSetting = PowerPoint.ShapeAutoSize.autoSizeShapeToFitText; shape.textFrame.textRange.text = shape.textFrame.textRange.text; shape.load("height" ); await context.sync(); shapeHeight = shape.height; } textWidths[i] = shapeWidth + trialStep; } let totalWidth = textWidths.reduce((sum, item ) => sum + item); if (totalWidth > length) { totalWidth /= 2 ; textWidths = textWidths.map((w ) => w / 2 ); } const spacing = (length - totalWidth) / sectionTitles.length; if (spacing < 0 ) { throw new Error ("Section name is too long." ); } const widths = textWidths.map(w => let cum = 0 ; const lefts = widths.map((_, i ) => { return (cum += i == 0 ? leftOffset : widths[i - 1 ]); }); shapes.map(shape => shape.delete(); }); await context.sync(); return widths.map((width, i ) => { return { top : topOffset, left : lefts[i], width : width, height : height }; }); }); }
输入的参数模型是与竖向方向高度相似的,实现的逻辑中仅仅是增加了迭代测试获得文本框的合适宽度的过程。另外还允许有一次换行,即章节标题显示为 2 行。但是如果章节标题显示为 3 行的话,一般来讲就不太合理了,因此在这里不过多地处理了,而是触发一个异常。
按页面数量成比例分布 除了以上两种分布方式之外,还可以按照页面数量成比例分布。这里面数据模型与上两小节一致,实现方式稍有差别。代码如下:
1
2
3
4
5
6
7
8
9
10
11
12
13
14
15
16
17
18
19
20
21
22
23
24
25
26
27
28
29
30
31
32
33
34
35
36
37
function computePropVerSlideNumber (args ) const { sectionTitles, slideSectionIds, edgeOffset, topOffset, btmOffset, width, dockRight } = args; const length = SLIDEHEIGHT - topOffset - btmOffset; const left = dockRight ? SLIDEWIDTH - edgeOffset - width : edgeOffset; const singleHeight = length / slideSectionIds.length; const heights = sectionTitles.map((name, i ) => { return slideSectionIds .map(id =>0 ) .reduce((sum, item ) => sum + item); }); let cum = 0 ; const tops = heights.map((_, i ) => { return cum += i == 0 ? topOffset : heights[i - 1 ]; }); return heights.map((h, i ) => { return { width : width, height : h, top : tops[i], left : left }; }); } function computePropHorSlideNumber (args ) const { sectionTitles, slideSectionIds, edgeOffset, leftOffset, btmOffset, height, dockBottom } = args; const length = SLIDEWIDTH - leftOffset - edgeOffset; const top = dockBottom ? SLIDEHEIGHT - edgeOffset - height : edgeOffset; const singleWidth = length / slideSectionIds.length; const widths = sectionTitles.map((name, i ) => { return slideSectionIds .map(id =>0 ) .reduce((sum, item ) => sum + item); }); let cum = 0 ; const lefts = widths.map((_, i ) => { return cum += i == 0 ? leftOffset : widths[i - 1 ]; }); return widths.map((w, i ) => { return { width : w, height : height, top : top, left : lefts[i] }; }); }
二者实现起来都不难。这里不再过多解释了。
均匀分布 按以上的方式把均匀分布的算法重构一下。代码如下:
1
2
3
4
5
6
7
8
9
10
11
12
13
14
15
16
17
18
19
20
21
22
23
24
25
function computePropVerUniform (args ) const { sectionTitles, slideSectionIds, edgeOffset, topOffset, btmOffset, width, dockRight } = args; const length = SLIDEHEIGHT - topOffset - btmOffset; const left = dockRight ? SLIDEWIDTH - edgeOffset - width : edgeOffset; const height = length / sectionTitles.length; const tops = Array (sectionTitles.length) .fill(0 ) .map((_, i ) => topOffset + i * height); return tops.map((t ) => { return { width : width, height : height, top : t, left : left }; }); } function computePropHorUniform (args ) const { sectionTitles, slideSectionIds, edgeOffset, leftOffset, btmOffset, height, dockBottom } = args; const length = SLIDEWIDTH - leftOffset - edgeOffset; const top = dockBottom ? SLIDEHEIGHT - edgeOffset - height : edgeOffset; const width = length / sectionTitles.length; const lefts = Array (sectionTitles.length) .fill(null ) .map((_, i ) => leftOffset + i * width); return lefts.map((left ) => { return { width : width, height : height, top : top, left : left }; }); }
用工厂模式封装 以上提供了六种不同的分布方式选择,写在不同的函数体中,并且使用不同形式的参数,使得每一个函数更加独立。下面使用简单工厂模式把这六种不同的分布方式封装到一个工厂中,获得使用统一数据模型的函数。
1
2
3
4
5
6
7
8
9
10
11
12
13
14
15
16
17
18
19
20
21
22
23
24
25
26
27
28
29
30
31
32
33
34
35
36
37
38
39
40
41
42
43
44
45
46
47
48
49
50
51
52
function defaultSectionBarConfig ( return { docking : "Top" , distribution : "EqualSpacing" , edgeOffset : 0 , startOffset : 0 , endOffset : 0 , width : 35 , sectionTitles : ['Introduction' , 'This section has a very very long title' , 'Results and Discussions' , 'Conclusions' ], slideSectionIds : [-1 , 0 , 0 , 1 , 1 , 1 , 2 , 2 , 3 ], activeFormat : {}, inactiveFormat : {}, }; } async function computeSectionBarProp (sectionBarConfig ) const { docking, distribution, edgeOffset, startOffset, endOffset, width, sectionTitles, slideSectionIds } = sectionBarConfig; const baseArgs = { sectionTitles, slideSectionIds, edgeOffset }; let direction; let args; if (docking === "Left" || docking === "Right" ) { direction = "Ver" ; args = { topOffset : startOffset, btmOffset : endOffset, width, dockRight : docking === "Right" , ...baseArgs }; } else if (docking === "Top" || docking === "Bottom" ) { direction = "Hor" ; args = { leftOffset : startOffset, rightOffset : endOffset, height : width, dockBottom : docking == "Bottom" , ...baseArgs }; } else { throw new Error ("Invalid docking" ); } let funcMapper = { VerUniform : computePropVerUniform, VerSlideNumber : computePropVerSlideNumber, VerEqualSpacing : computePropVertEqualSpacing, HorUniform : computePropHorUniform, HorSlideNumber : computePropHorSlideNumber, HorEqualSpacing : computePropHorEqualSpacing }; return await funcMapper[direction + distribution](args); }
一般来讲,工厂模式要返回一个函数。这里工厂所需要的参数定义在了数据模型中,所以索性把结果直接算出来。因此,这不是严格意义上的工厂函数。仅仅是一个根据参数调用不同函数的函数而已。
函数 defaultSectionBarConfig() 用于返回一个初始的设置参数对象。它不仅可以在后续的变成中提示开发者正在使用的数据模型,还可以在开发和生产中都作为默认值传入。如果项目比较大,最好是使用 jsDoc 写一个数据接口的文档,甚至是使用 TypeScript 严格地定义接口。这里我们项目比较小,而且只有我一个人做全栈开发,所以偷懒就不写了。
重写创建章节标题的函数 有了每个章节标题的定位和高宽信息,就可以根据它们来创建导航栏的章节标题了。因此我们把上一节的 run() 函数加以修改。
1
2
3
4
5
6
7
8
9
10
11
12
13
14
15
16
17
18
19
20
async function createSectionBar (sectionBarConfig ) const { sectionTitles, slideSectionIds, activeFormat, inactiveFormat } = sectionBarConfig; await PowerPoint.run(async (context) => { const shapeProps = await computeSectionBarProp(sectionBarConfig); slideSectionIds.map((id, n ) => { const shapes = context.presentation.slides.getItemAt(n).shapes; sectionTitles.map((name, i ) => { const shape = shapes.addTextBox(name, shapeProps[i]); shape.textFrame.autoSizeSetting = PowerPoint.ShapeAutoSize.autoSizeNone; shape.name = `NavbarSectionTextbox-${n} -${i} ` ; if (id == i) { setTextboxFormat(shape, activeFormat); } else { setTextboxFormat(shape, inactiveFormat); } }); }); await context.sync(); }); }
上面函数中,我们从 sectionBarConfig 中读取了两个尚为空对象的值 activeFormat 和 inactiveFormat 。它们是用于定义 sectionBar 的样式的。在下一节中来对它们进行定义。
设置样式 样式数据模型 上一节的 createSectionBar() 函数中,调用了一个尚未定义的函数 setTextboxFormat 。这个函数用于设置文本框的样式。在本节我们就定义文本框样式的数据格式,并实现这个函数。
目前 PowerPoint 的 javascript API库还处于比较初级的阶段,可以使用的功能相对是比较少的。通过阅读文档,可以找到一个 Shape 可以定义的所有格式。把我们需要的格式提取出来,作为格式输入的数据模型。这一模型如下:
1
2
3
4
5
6
7
8
9
10
11
12
13
14
15
16
17
18
19
20
21
22
23
24
25
26
27
28
name id width height left top fill: foregroundColor transparency lineFormat: color transparency style dashStyle weight textFrame: verticalAlignment: textRange: text paragraphFormat: horizontalAlignment font: size name color bold italic underline
其他格式有些是 API 没有暴露,有些是没有必要修改(如 Margin 等,我们的加载项不去修改这些值)。另外值得注意的是,对于最外层的一些属性,如 name height 等,以及文本框中的文字值 text,是需要通过加载项计算得出数据的,我们获取过来的意义只是读取它的值,在设置的时候要根据计算结果来设置新值。
那么我们就使用两个对象 activeFormat 和 inactiveFormat 来储存需要的格式。代码如下:
1
2
3
4
5
6
7
8
9
10
11
12
13
14
15
16
17
18
19
20
21
22
23
24
25
26
27
28
29
30
31
32
33
34
35
36
37
38
39
40
41
42
43
44
45
46
47
48
49
50
51
52
53
54
55
56
57
58
59
60
61
62
63
64
65
66
67
68
69
70
71
72
73
74
75
76
77
function defaultActiveFormat ( return { name : "" , id : "" , width : 0 , height : 0 , left : 0 , top : 0 , fill : { foregroundColor : "#3d3d3e" , transparency : 0 }, lineFormat : { color : "#3d3d3e" , transparency : 0 , style : "Single" , dashStyle : "Solid" , weight : 0.75 }, textFrame : { verticalAlignment : "Top" , textRange : { paragraphFormat : { horizontalAlignment : "Left" , text : "" }, font : { size : 18 , name : "Calibri" , color : "#ffffff" , bold : true , italic : false , underline : "None" } } } }; } function defaultInactiveFormat ( return { name : "" , id : "" , width : 0 , height : 0 , left : 0 , top : 0 , fill : { foregroundColor : "#3d3d3e" , transparency : 0 }, lineFormat : { color : "#3d3d3e" , transparency : 0 , style : "Single" , dashStyle : "Solid" , weight : 0.75 }, textFrame : { verticalAlignment : "Top" , textRange : { paragraphFormat : { horizontalAlignment : "Left" , text : "" }, font : { size : 18 , name : "Calibri" , color : "#afafaf" , bold : true , italic : false , underline : "None" } } } }; }
这两个初始值也使用函数封装起来。这里要注意将 defaultSectionBarConfig() 函数中两个对应的值从空值更新为默认值。
1
2
3
4
5
6
7
function defaultSectionBarConfig ( return { activeFormat : defaultActiveFormat(), inactiveFormat : defaultInactiveFormat(), } }
设置样式的函数 定义好了数据模型后,就可以实现 setTextboxFormat() 函数了。
1
2
3
4
5
6
7
8
9
function setTextboxFormat (shape, format ) shape.fill.color = format.fill.color; shape.fill.transparency = format.fill.transparency; Object .assign(shape.lineFormat, format.lineFormat); shape.textFrame.verticalAlignment = format.textFrame.verticalAlignment; shape.textFrame.textRange.paragraphFormat.horizontalAlignment = format.textFrame.textRange.paragraphFormat.horizontalAlignment; Object .assign(shape.textFrame.textRange.font, format.textFrame.textRange.font); }
读取现有文本框的样式 样式的参数比较多,一个一个让用户设置很麻烦,而且每一个参数理解起来也需要一定时间。一个更简便的操作是用户从图形化的页面中创建一个文本框,然后让加载项读取该文本框的格式。我们下面来写一个函数实现这个功能。
1
2
3
4
5
6
7
8
9
10
11
12
13
14
15
16
17
18
19
20
21
22
23
24
25
26
27
28
29
30
31
32
33
34
35
36
37
38
39
40
41
42
43
44
45
46
47
48
49
50
51
52
53
54
55
56
57
58
async function readSelectedTextboxFormat ( return await PowerPoint.run(async (context) => { const shapes = context.presentation.getSelectedShapes(); shapes.load("items" ); await context.sync(); if (shapes.items.length === 0 ) { throw new Error ("No shape is selected." ); } const shape = shapes.items[0 ]; shape.load("$all" ); await context.sync(); const fill = shape.fill.load("$all" ); const lineFormat = shape.lineFormat.load("$all" ); const textFrame = shape.textFrame.load("$all, textRange/paragraphFormat, textRange/text, textRange/font" ); await context.sync(); const paragraphFormat = textFrame.textRange.paragraphFormat; const font = textFrame.textRange.font; paragraphFormat.load("$all" ); font.load("$all" ); await context.sync(); return { name : shape.name, id : shape.id, left : shape.left, top : shape.top, width : shape.width, height : shape.height, fill : { foregroundColor : fill.foregroundColor, transparency : fill.transparency }, lineFormat : { color : lineFormat.color, transparency : lineFormat.transparency, style : lineFormat.style, dashStyle : lineFormat.dashStyle, weight : lineFormat.weight }, textFrame : { verticalAlignment : textFrame.verticalAlignment, textRange : { text : textFrame.textRange.text, paragraphFormat : { horizontalAlignment : paragraphFormat.horizontalAlignment }, font : { size : font.size, name : font.name, color : font.color, bold : font.bold, italic : font.italic, underline : font.underline } } } }; }); }
测试读取结果 下面我们来测试一下读取到的数据是什么样子。在 HTML 中再增加一个按钮,并在 Script 中绑定一个 log() 函数。定义以下测试函数:
1
2
3
async function log ( console .log(await readSelectedTextboxFormat()); }
这样,点击 Log 按钮,就可以在控制台中看到读取的数据了。这时会发现,读取到的数据有些并不和我们想像中的一样。比如 color 为空值,这是指透明。一开始在写代码的时候我也直接将 color='' 赋值给了 shape ,但是为空的时候就会报错。这是因为该属性的 setter 不支持设为空值。查阅文档发现它要通过 clear() 方法来清空。同时在设置 color 的时候也宜使用 setSolodColor() 方法来设,因为虽然目前不支持设置图片、底纹和渐变色,但是以后可能会加入这些功能,使用函数来设置比对属性直接赋值是更安全的操作。再比如 lineFormat.weight ,可能会返回 -1 ,这时我们就要在数据模型中保存它的默认值 0.75 。再比如没有边框时, lineFormat.color 是空值,这就需要我们来进行空值的处理。经过处理之后,把 setTextboxFormat() 函数修改如下:
1
2
3
4
5
6
7
8
9
10
11
12
13
14
15
16
17
18
19
20
21
22
23
24
25
function setTextboxFormat (shape, format ) if (format.fill.foregroundColor === "" ) { shape.fill.clear(); } else { shape.fill.setSolidColor(format.fill.foregroundColor); } shape.fill.transparency = format.fill.transparency; if (format.lineFormat.color === "" ) { if (format.fill.foregroundColor === "" ) { shape.lineFormat.visible = false ; } else { shape.lineFormat.color = format.fill.foregroundColor; } } else { shape.lineFormat.color = format.lineFormat.color; shape.lineFormat.transparency = format.lineFormat.transparency; shape.lineFormat.style = format.lineFormat.style; shape.lineFormat.dashStyle = format.lineFormat.dashStyle; shape.lineFormat.weight = format.lineFormat.weight === -1 ? 0.75 : format.lineFormat.weight; } shape.textFrame.verticalAlignment = format.textFrame.verticalAlignment; shape.textFrame.textRange.paragraphFormat.horizontalAlignment = format.textFrame.textRange.paragraphFormat.horizontalAlignment; Object .assign(shape.textFrame.textRange.font, format.textFrame.textRange.font); }
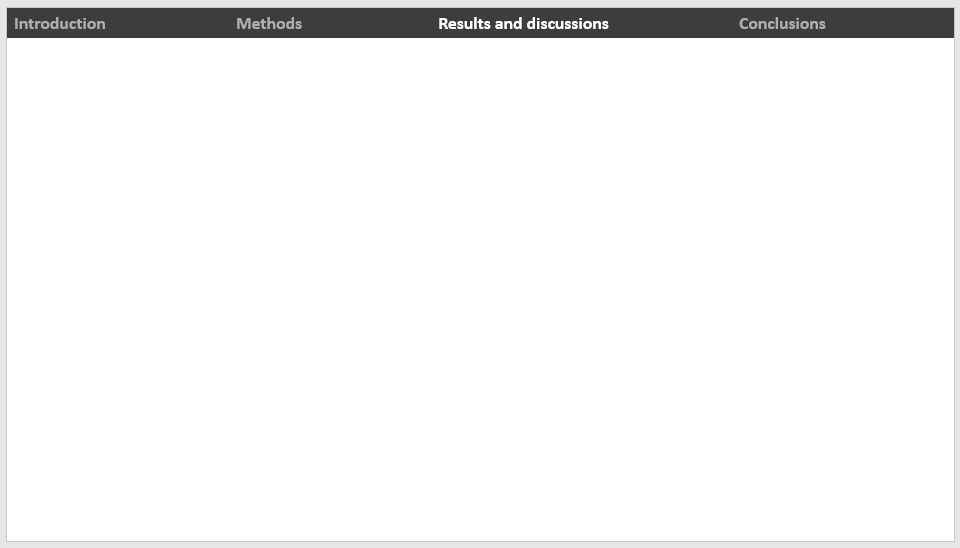
经过以上处理,就可以在 PowerPoint 中生成想要的导航栏了。这里放一页通过默认属性生成的导航栏:
目前 Navbar 的配置还是需要通过编写代码来实现。在下一篇文章中我们来一起构建前端页面。